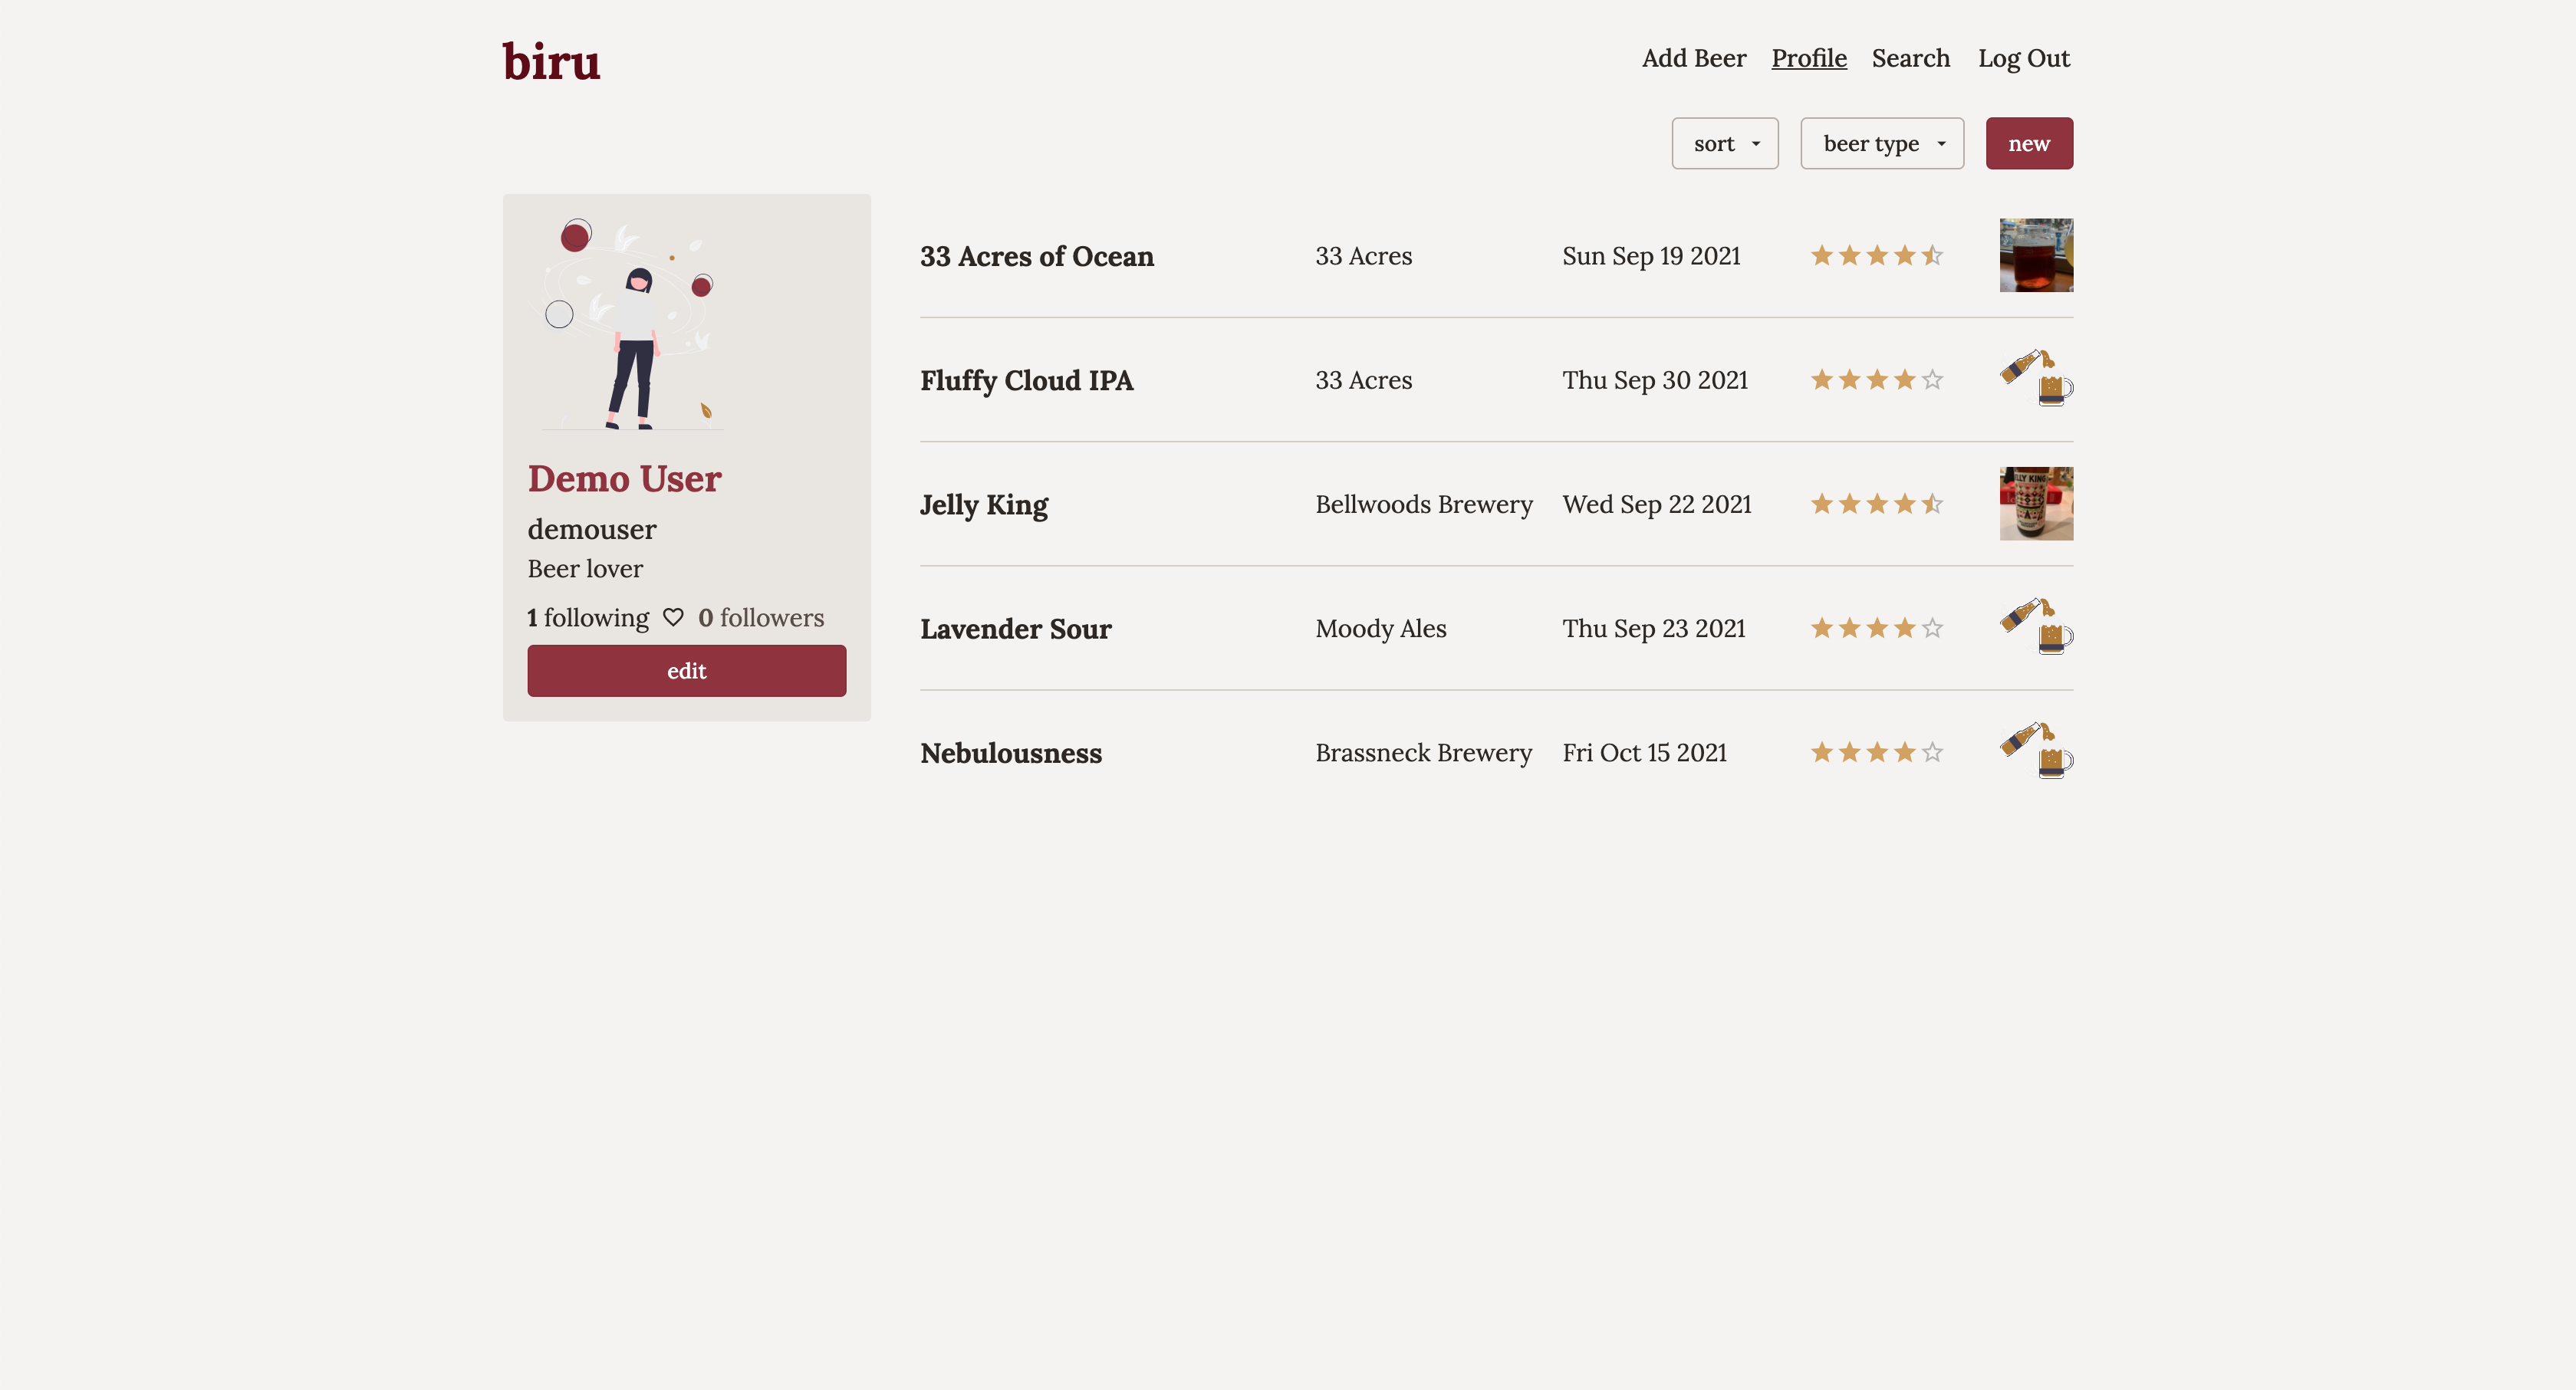
biru
full stack
React
Next
SCSS
Express
PostgreSQL
Sequelize
Type: Personal project
Description: biru is a beer journal app with CRUD functionality and session-based user authentication. Once a user creates a profile, they can keep track of new beers that they try by adding them to to their journal. They can also search for, view and follow other users. The Sequelize ORM is used to interface with a Postgres database, and images uploads are managed by Cloudinary.
This project greatly improved my skills with SQL and back end development. I explored different authentication patterns, learning more about cookies and CORS during development and deployment.
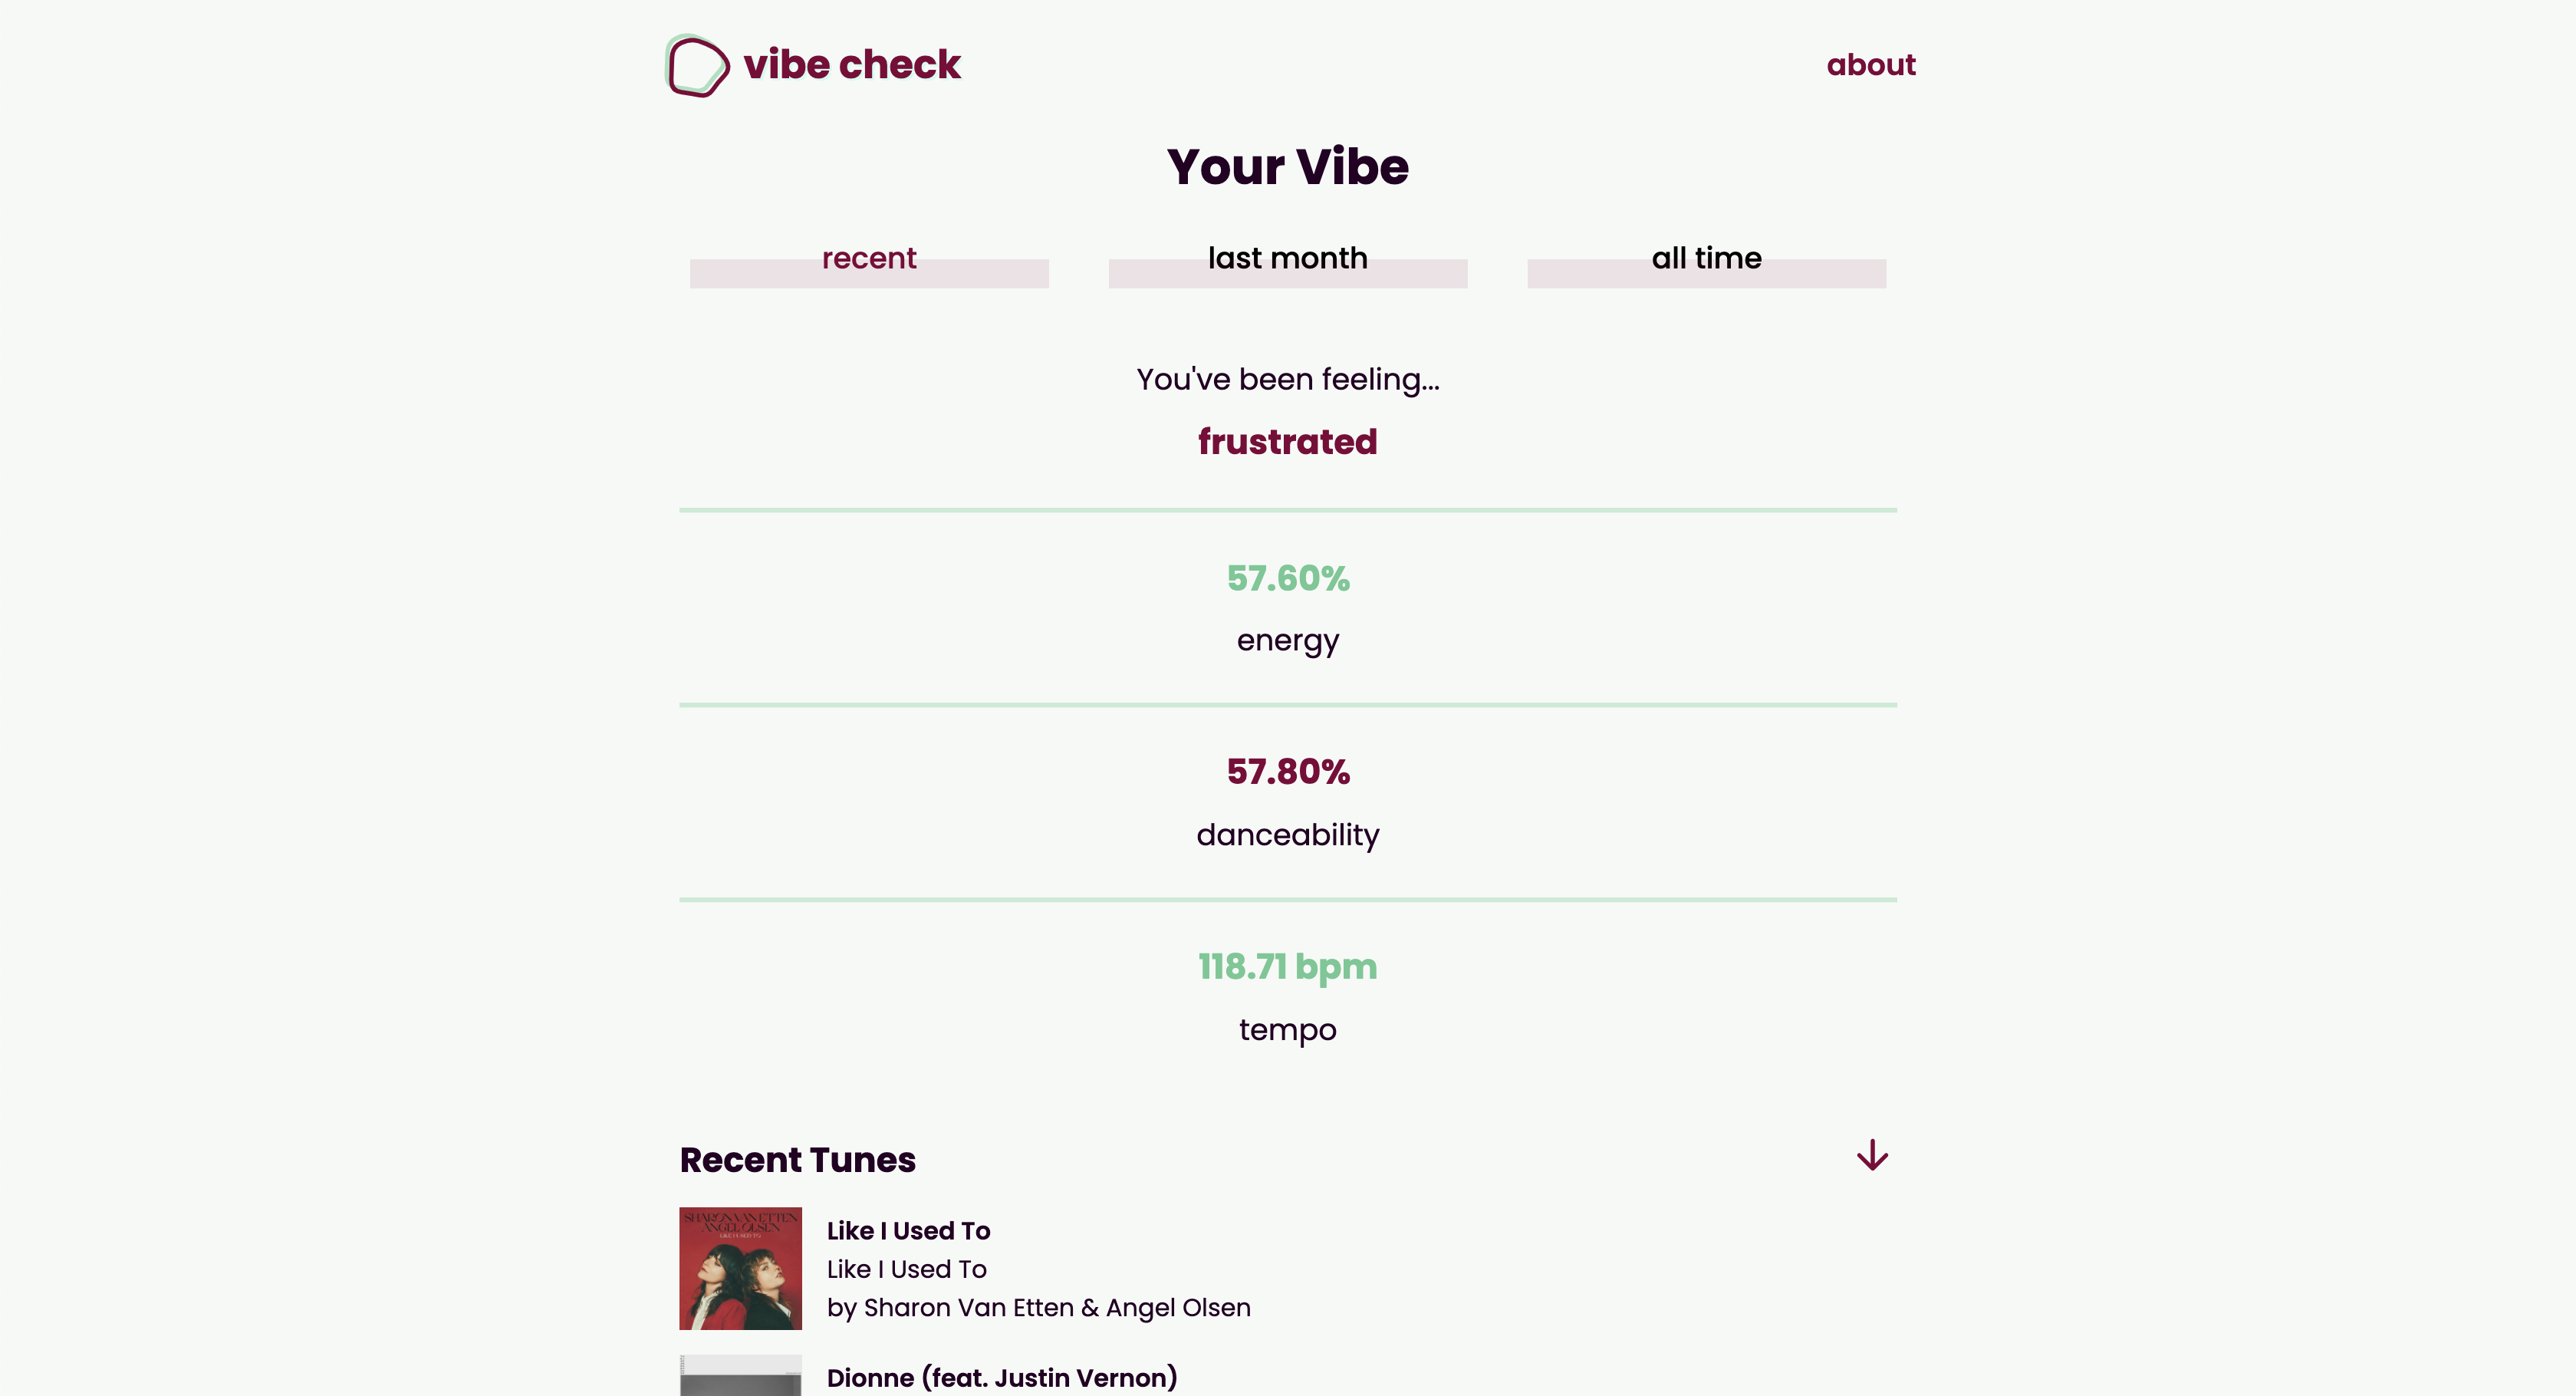
vibe check
full stack
React
Next
Express
SCSS
Type: Personal project
Description: vibe check is a web app that determines your mood from your Spotify listening history. Users log in to their Spotify account using Spotify's OAuth 2.0 framework, and their vibe is detected for different time scales from their recent listening history or top played songs. Users can save these songs to playlists for future listening.
This was my first big personal web development project, and I learned a lot from it. I greatly improved my front end skills with Next and SCSS and became more familiar with back end development, calling external APIs, and OAuth 2.0.
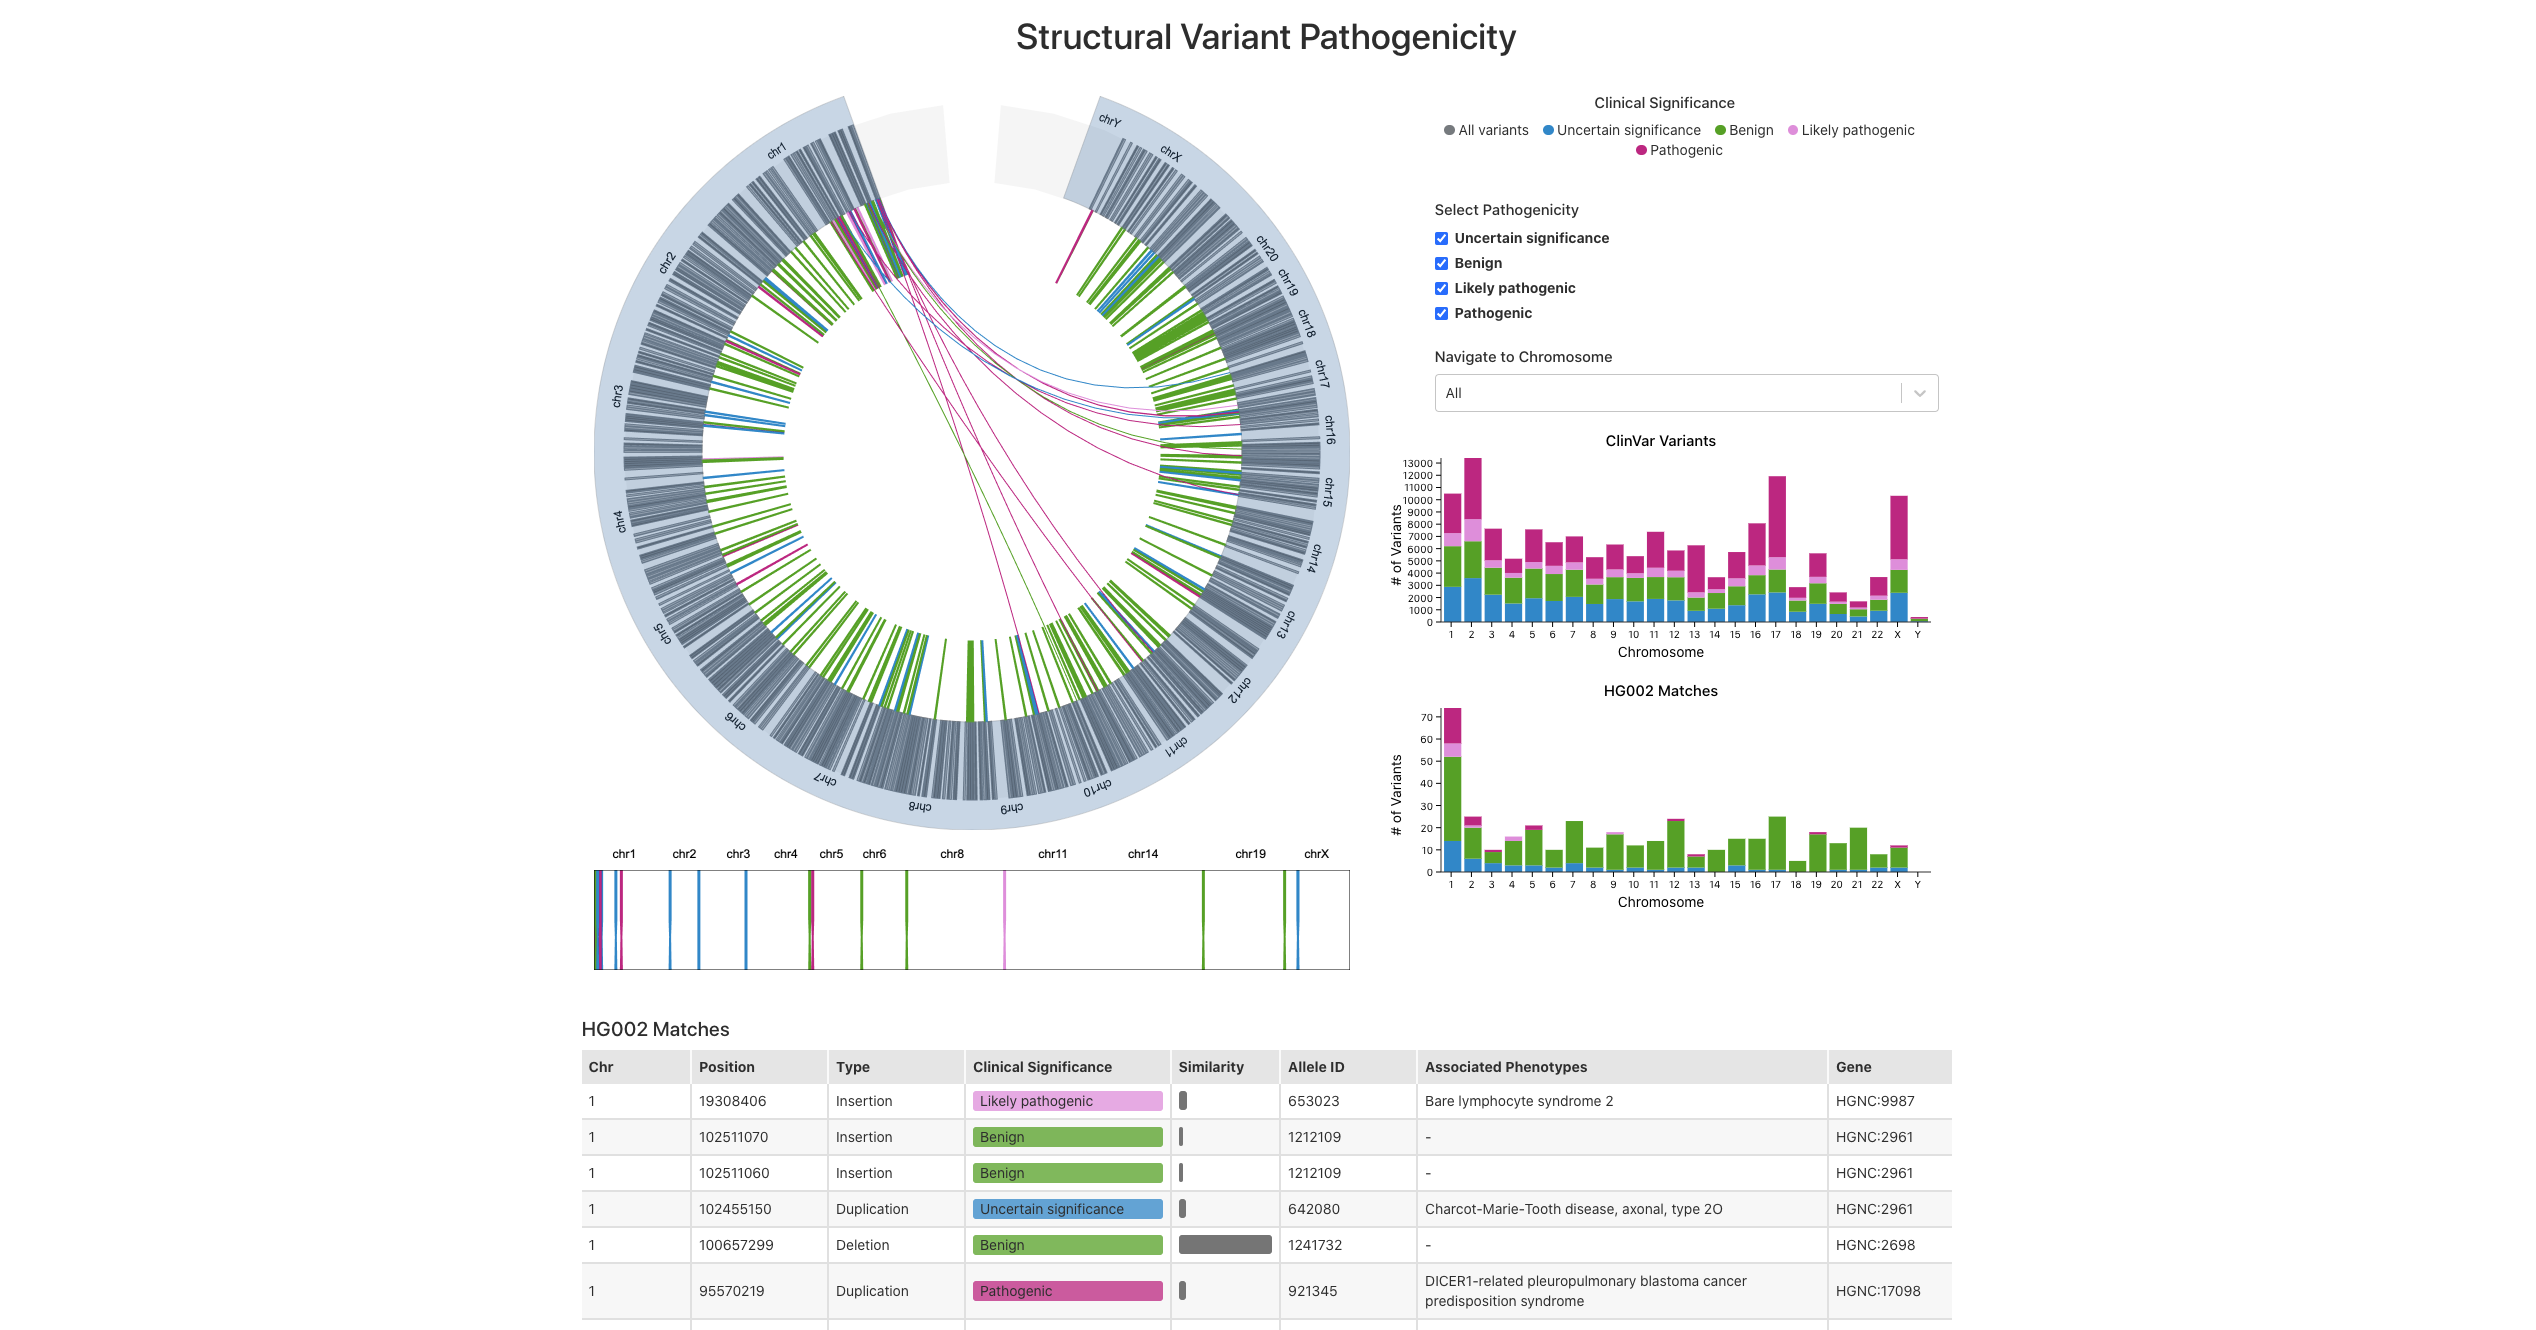
Structural Variant Pathogenicity Visualization
front end
data visualization
React
D3
Gosling
Type: Course project, collaboration
Contribution: Design, writing and implementation (stacked bar charts, data selection & filtering, interactions, table)
Description: For my Information Visualization course's final project, my group created a multi-scale visualization panel of HG002 structural variants. The HG002 variants were annotated with pathogenicity information by identifying matches to ClinVar, and these matches are presented in several linked views.
Users can explore and navigate the dataset in a genomic context using a Circos plot and linear view, both implemented with Gosling. The HG002 and ClinVar datasets are summarized in stacked bar charts implemented using D3. An interactive table displays the attributes of matching variants with some visual encodings. Users can filter and select data to reduce the number of items shown.